VIX Trading: Decoding the Volatility Index & How to Use it to Predict Market Reversals (Beginner Guide)
📅 23.04.2026 👤 Aaron Akwu
If you’re trying to predict stock market reversals, one of the most popular measures to watch is the VIX (Volatility Index), often referred to by its ticker symbol 'VIX' in trading and financial discussions. Often called the “Fear Index” or “Fear Gauge,” the VIX index is calculated by the Chicago Board Options Exchange (Cboe Global Markets) and is a forward-looking indicator that reflects the market's expectations for volatility over the next 30 days. The VIX is derived from the prices of S&P 500 index options, making it a key measure of implied volatility and investor sentiment in the market.
The VIX is a popular measure of expected market volatility in the S&P 500. It is derived from option prices of SPX options contracts and represents the weighted average of implied volatility across different strike prices, including both Cboe-traded standard SPX options and weekly SPX options. The inclusion of weekly expirations provides more frequent trading opportunities and can influence short-term trading strategies.
Think of the VIX as a market index that helps market participants gauge investor sentiment:
Low volatility (lower values): Investors are calm, confidence is high, and equity portfolios remain stable.
High volatility (higher values): Investors are fearful, financial markets are shaky, and stock market volatility increases.
VIX Spike: A sudden surge in current volatility when panic sets in.
The VIX is calculated by taking the square root of the total variance derived from the weighted average of implied volatilities, resulting in the standard deviation, which is then scaled to determine the VIX value. Implied volatility increases the VIX when traders buy more S&P 500 options to hedge against market swings. Unlike equities, the VIX tends to revert to its mean price over time, a behavior known as mean reversion, where its value gravitates toward its historical average.
The spot VIX is the current price of the index, while VIX futures contracts and VIX options trade allow traders to speculate on future volatility.
How the VIX Index is Calculated
The VIX Index, officially known as the Cboe Volatility Index, is a sophisticated measure of market volatility that reflects the market’s expectations for future volatility in the S&P 500 index over the next 30 days. Calculated and published in real-time by the Chicago Board Options Exchange (Cboe Global Markets), the VIX is derived from the prices of a wide range of S&P 500 index options.
The generalized formula for the VIX Index:
σ2 =
2T
∑i
ΔKiK2i
eRT Q(Ki) −
1T
[
FK0
− 1 ]2
Where:σ: VIX value (σ × 100); T: Time to expiration; ΔKᵢ: Interval between strike prices; Q(Kᵢ): Midpoint of bid-ask spread.
Here’s how the VIX Index is calculated:
Selection of Options: The process begins by selecting a broad set of S&P 500 index options, both calls and puts, with strike prices above and below the current level of the S&P 500 index. These options must have active trading and sufficient liquidity.
Implied Volatility Calculation: For each selected option, the implied volatility is determined using models like Black-Scholes. Implied volatility represents the market’s expectations of how much the S&P 500 might move.
Weighting by Liquidity and Expiry: Each option’s implied volatility is weighted based on its liquidity and the time remaining until expiration. This ensures that more relevant and actively traded options have a greater influence on the final index value.
Averaging the Results: The weighted implied volatilities are then averaged to produce a single value—the VIX Index—which represents the expected volatility for the next 30 days.
Real-Time Publication: The VIX Index is updated and published in real-time, providing traders and investors with a constantly updated gauge of market sentiment and expected volatility.
Understanding how the VIX Index is calculated helps traders and investors interpret its values more accurately. Since the VIX is based on real-time option prices, it serves as a dynamic indicator of market sentiment, allowing market participants to gauge whether the market expects calm or turbulent times ahead. By tracking the VIX, traders can make more informed decisions about managing risk and anticipating shifts in market volatility.
Real-World Example: The "Insurance" Effect
Imagine you own a house in a forest:
Sunny Day (Low VIX): Insurance is cheap, reflecting more stability in the market.
Smoke on the Horizon (VIX Spike): Insurance costs skyrocket, just like futures price and option prices rise when investor fear spreads.
In the financial markets, “insurance” = SPX options. When the underlying price of the S&P 500 index drops, demand for options contracts surges → VIX price rises.
Why the VIX and Stock Market Move Opposite
The VIX volatility index and the stock market move in opposite directions about 80% of the time:
S&P 500 down → VIX up (Fear rising)
S&P 500 up → VIX down (Confidence returning)
Because investor fear is stronger than greed, the VIX position usually rises faster than it falls.
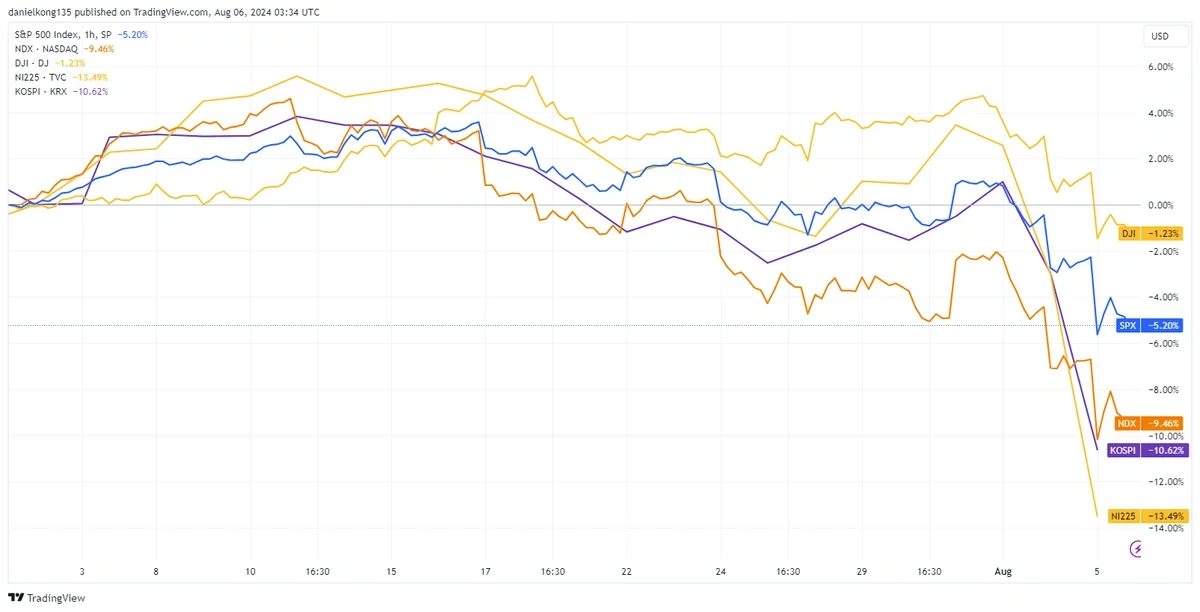
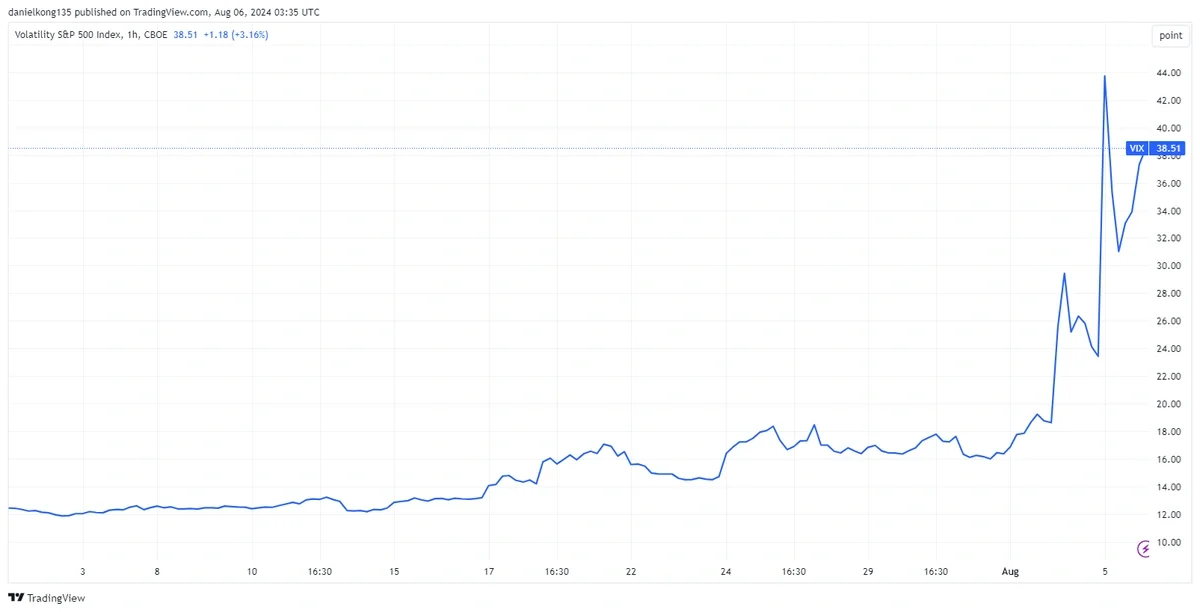
Historical inverse correlation between S&P 500 (Price) and VIX (Volatility) during market stress.
Graph of S&P 500, Nasdaq, DJIA, Nikkei and Kospi from 1 July 2024 to 5 August 2024 (https://www.tradingview.com/x/HAkCfZ8V/)Graph of VIX from 1 July 2024 to 5 August 2024 (https://www.tradingview.com/x/opFhJFvf/)
VIX Levels Cheat Sheet
VIX Level
Market Sentiment
What It Means
Below 15
Complacency
Calm markets, realized volatility remains low
15 – 25
Normal
Standard deviation of volatility products
25 – 35
High Stress
Correction territory, big swings in equity market volatility
Above 40
Extreme Panic
Major crisis (e.g., 2008 crash, 2020 pandemic, 2024 crisis)
It's important to note that the VIX can remain low even during periods of market decline, so monitoring volatility on its own terms is essential.
Using the VIX as a Hedge
The VIX Index is not just a barometer of market volatility - it’s also a powerful tool for hedging against sudden swings in the stock market. Because the VIX tends to move inversely to the S&P 500 index, it can help protect equity portfolios when market sentiment turns negative and expected volatility rises.
Here are some of the main ways traders and investors use the VIX Index as a hedge:
VIX Futures Contracts: By buying VIX futures contracts, traders can speculate on or hedge against future volatility. If market volatility spikes and the VIX index rises, the value of these futures contracts typically increases, offsetting losses in equity portfolios.
VIX Options: VIX options provide the right, but not the obligation, to buy or sell the VIX at a specific strike price. These options can be used to hedge against sharp increases in market volatility, offering protection when the market turns turbulent.
VIX ETFs: Exchange traded funds (VIX ETFs) track the performance of VIX futures and offer a convenient way for investors to gain exposure to volatility without trading futures contracts directly. These funds can be used to hedge against declines in the S&P 500 index or to profit from rising volatility.
VIX ETNs: Exchange traded notes (VIX ETNs) are another way to gain exposure to the VIX index. Like ETFs, they track VIX futures but are structured as debt securities, offering different risk and tax profiles.
Using the VIX as a hedge allows traders and investors to reduce their exposure to market volatility and protect their portfolios from sudden downturns. However, it’s important to understand the unique characteristics and risks of VIX products—such as daily decay in VIX ETFs and the complexities of futures contracts. These instruments are best suited for those who are familiar with volatility products and the mechanics of the VIX index.
Beyond hedging, monitoring the VIX index helps gauge market sentiment and expected volatility, providing valuable insights for adjusting investment strategies. For example, a sudden surge in the VIX may signal rising investor fear and potential market reversals, while a declining VIX can indicate stabilizing conditions. By incorporating VIX trading strategies and keeping an eye on the VIX futures curve, traders can identify opportunities to protect or enhance their portfolios in changing market environments.
Strategy: Using the VIX to Predict Market Reversals
The best time to buy stocks is often when everyone else is terrified (capitulation).
The "Rubber Band" Strategy
Watch for the Spike: VIX jumps aggressively (e.g., 18 → 32).
Find the Floor: Check if the S&P 500 is hitting a major support level.
Wait for the Turn: Don’t buy while the VIX futures curve climbs. Wait for its first “down day.”
The Trade: When VIX values fall, peak fear has passed → relief rally likely.
Traders often use VIX ETFs or exchange traded notes (ETNs) to gain exposure to volatility products without holding a physical asset.
Common VIX Trading Mistakes
Buying the VIX directly: You can’t. Use exchange traded funds (ETFs) like VXX.
Holding VIX ETFs too long: They decay daily, designed for short term volatility trades.
Buying too early: A high VIX volatility can remain high for weeks. Always wait for confirmation.
VIX Market Reversal Checklist
Identify the Fear Zone: Is the volatility index VIX above 25–30?
Spot the Panic Spike: Has the spot price jumped 20%+ in 2–3 days?
Check for Price Support: Is the SPX index at a major floor?
Confirm the Turn: Has the VIX closed lower after a spike?
Look for the Relief Rally: Falling VIX values + higher low on price chart.
Frequently Asked Questions (FAQ)
Q: What is a “good” VIX level for buying stocks? A: Many traders look for opportunities when VIX remains high (above 30) for several days, signaling oversold conditions.
Q: Why does the VIX go down when the market goes up? A: Rising equity portfolios = less demand for options contracts → lower values in the VIX index calculated.
Q: Can the VIX predict a crash? A: No. The volatility index is reactive, not predictive. It spikes during panic.
Q: What is “implied volatility”? A: It’s the market’s expectations of future volatility. High VIX price = high implied volatility.
Q: Why does the VIX peak before the market bottoms? A: Investor sentiment shifts once bad news is absorbed. Panic fades, even if stock market volatility remains.
Disclaimer: The content of this article is intended for informational purposes only and should not be considered professional advice.
When you visit any website, it may store or retrieve information on your browser, mostly in the form of cookies. This information might be about you, your preferences or your device and is mostly used to make the site work as you expect it to. The information does not usually directly identify you, but it can give you a more personalized web experience. Because we respect your right to privacy, you can choose not to allow some types of cookies. Click on the different category headings to find out more and change our default settings. However, blocking some types of cookies may impact your experience of the site and the services we are able to offer.
More information
By clicking “Accept All Cookies”, you agree to the storing of cookies on your device to enhance site navigation, analyze site usage, and assist in our marketing efforts.
 Balance Guard